Analysis tools
Search bar
The Search Bar enables you to locate assets of your schematisation. You can search for asset type (e.g. pipe), name, code or id.
Point selection tool
Using the Point selection tool, you can click anywhere on the map to visualize the elevation or time series at that location: water depth, (ground)water level, and rain intensity.
The time series can all be downloaded in CSV format. The points in the graphs in Fig. 13 are the points calculated by the 3Di calculation core and are independent from the output time step that the modeller has set while following a location. If a location is clicked later during the simulation, the historic values on the graph are the values shown according to the output time step.
Note
Water depth is not shown for channel nodes
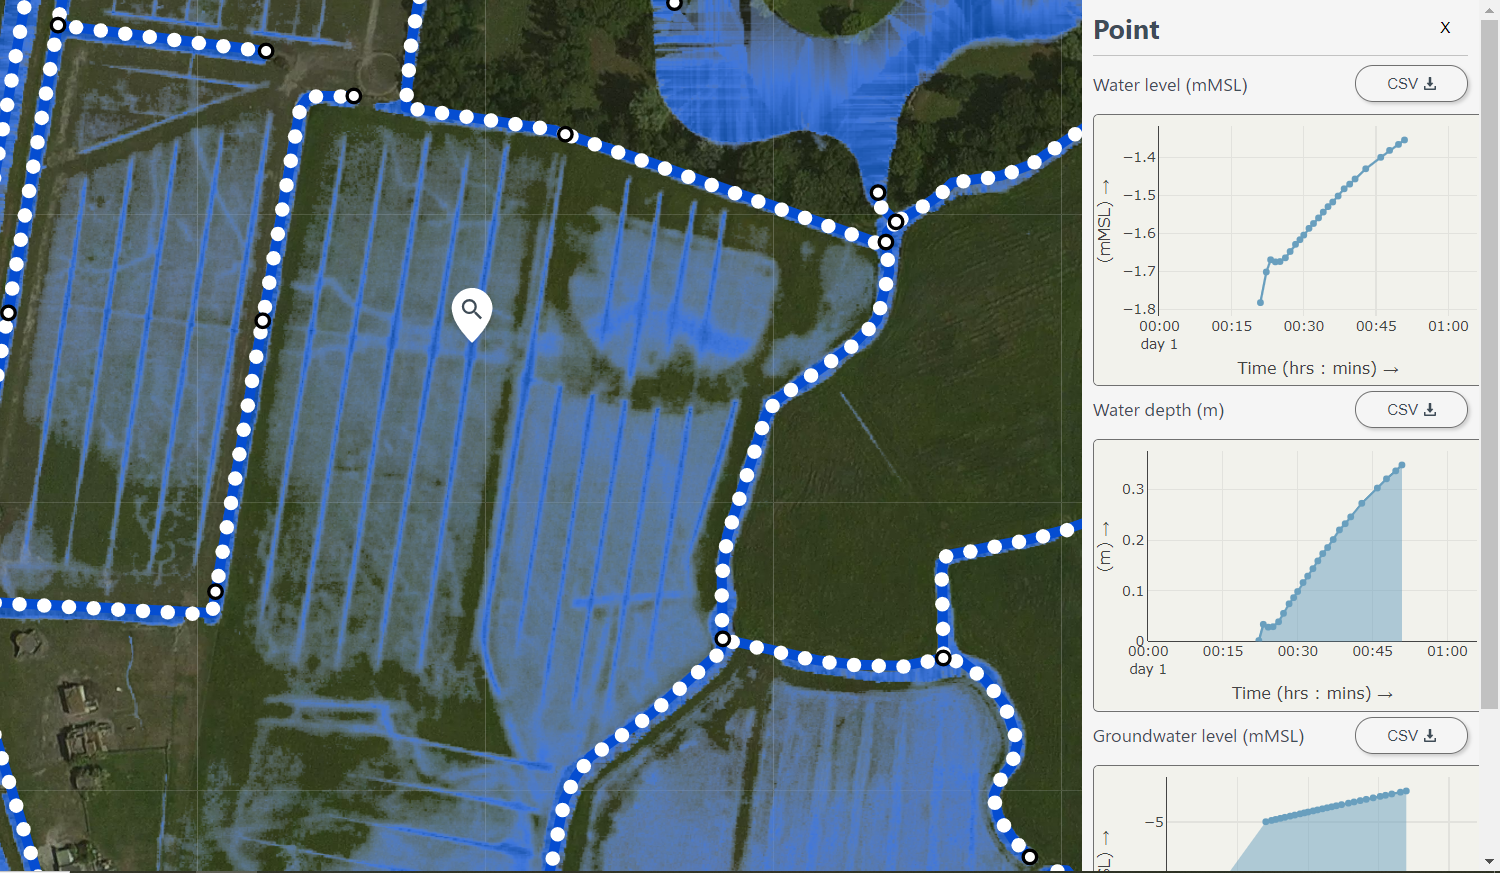
Fig. 13 Point selection tool.
Line selection tool
The Line-selection tool allows you to draw a trajectory on the map, to show the elevation profile (side view), together with the water level along that trajectory. Create the trajectory by clicking in any place on the map (within the 2D model domain) to add vertices and finish by clicking the check mark.
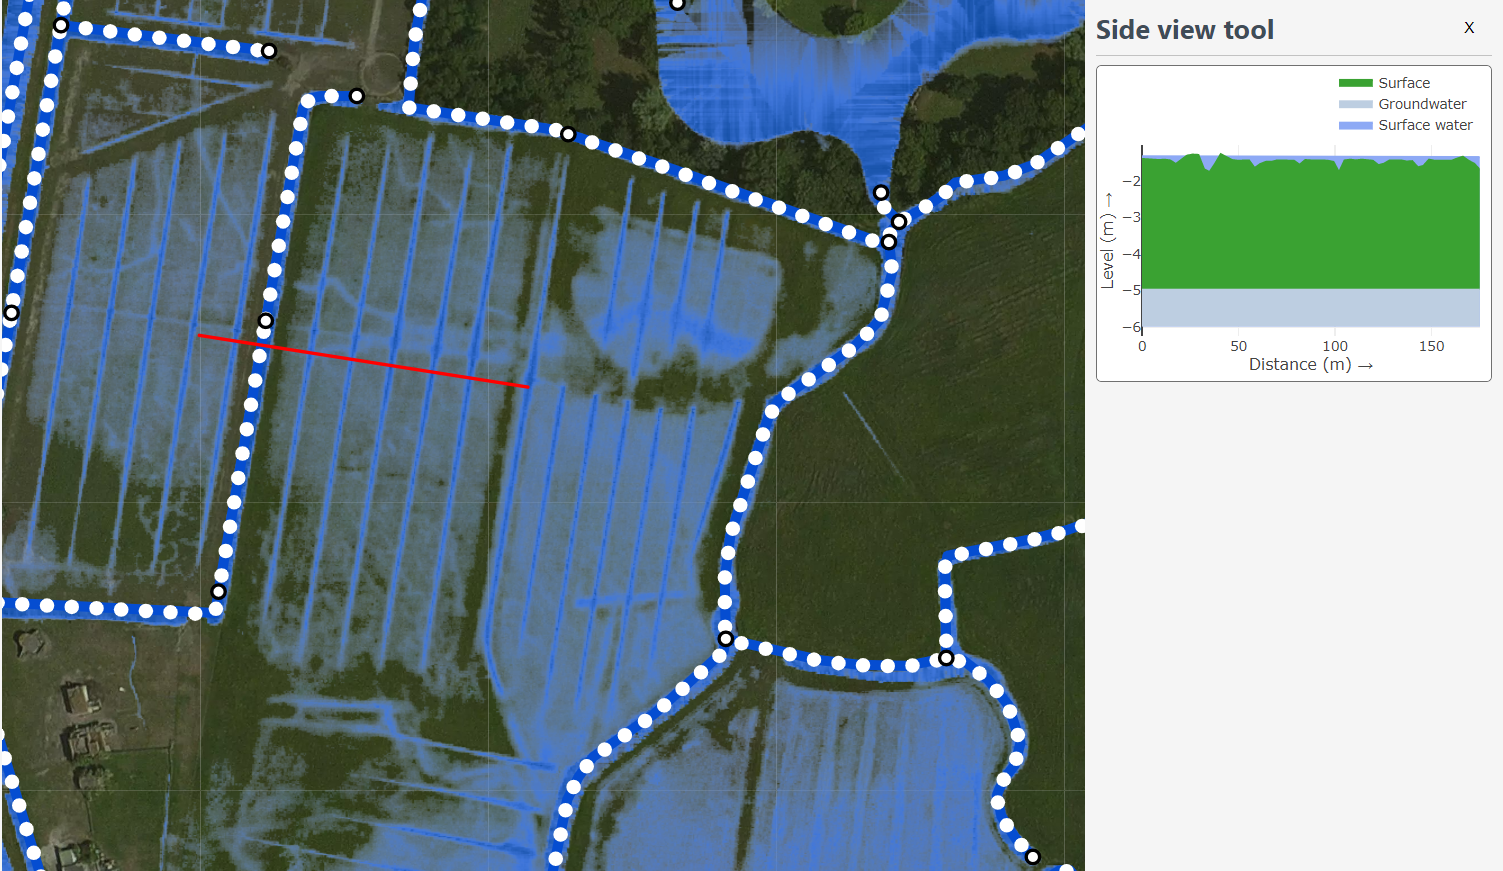
Fig. 14 Line selection tool.
The side view shows the elevation in green and the water in blue. By hovering over the graph with the mouse, exact values can be seen. A dot will move over the trajectory in the map to indicate the exact location you are viewing in the plot. Keeping this graph open while the simulation progresses will show you how the water level rises or falls. Note that the model used for the example also contains a groundwater component, indicated by an extra blue line; this will only be shown if your model also contains a groundwater component.
1D network
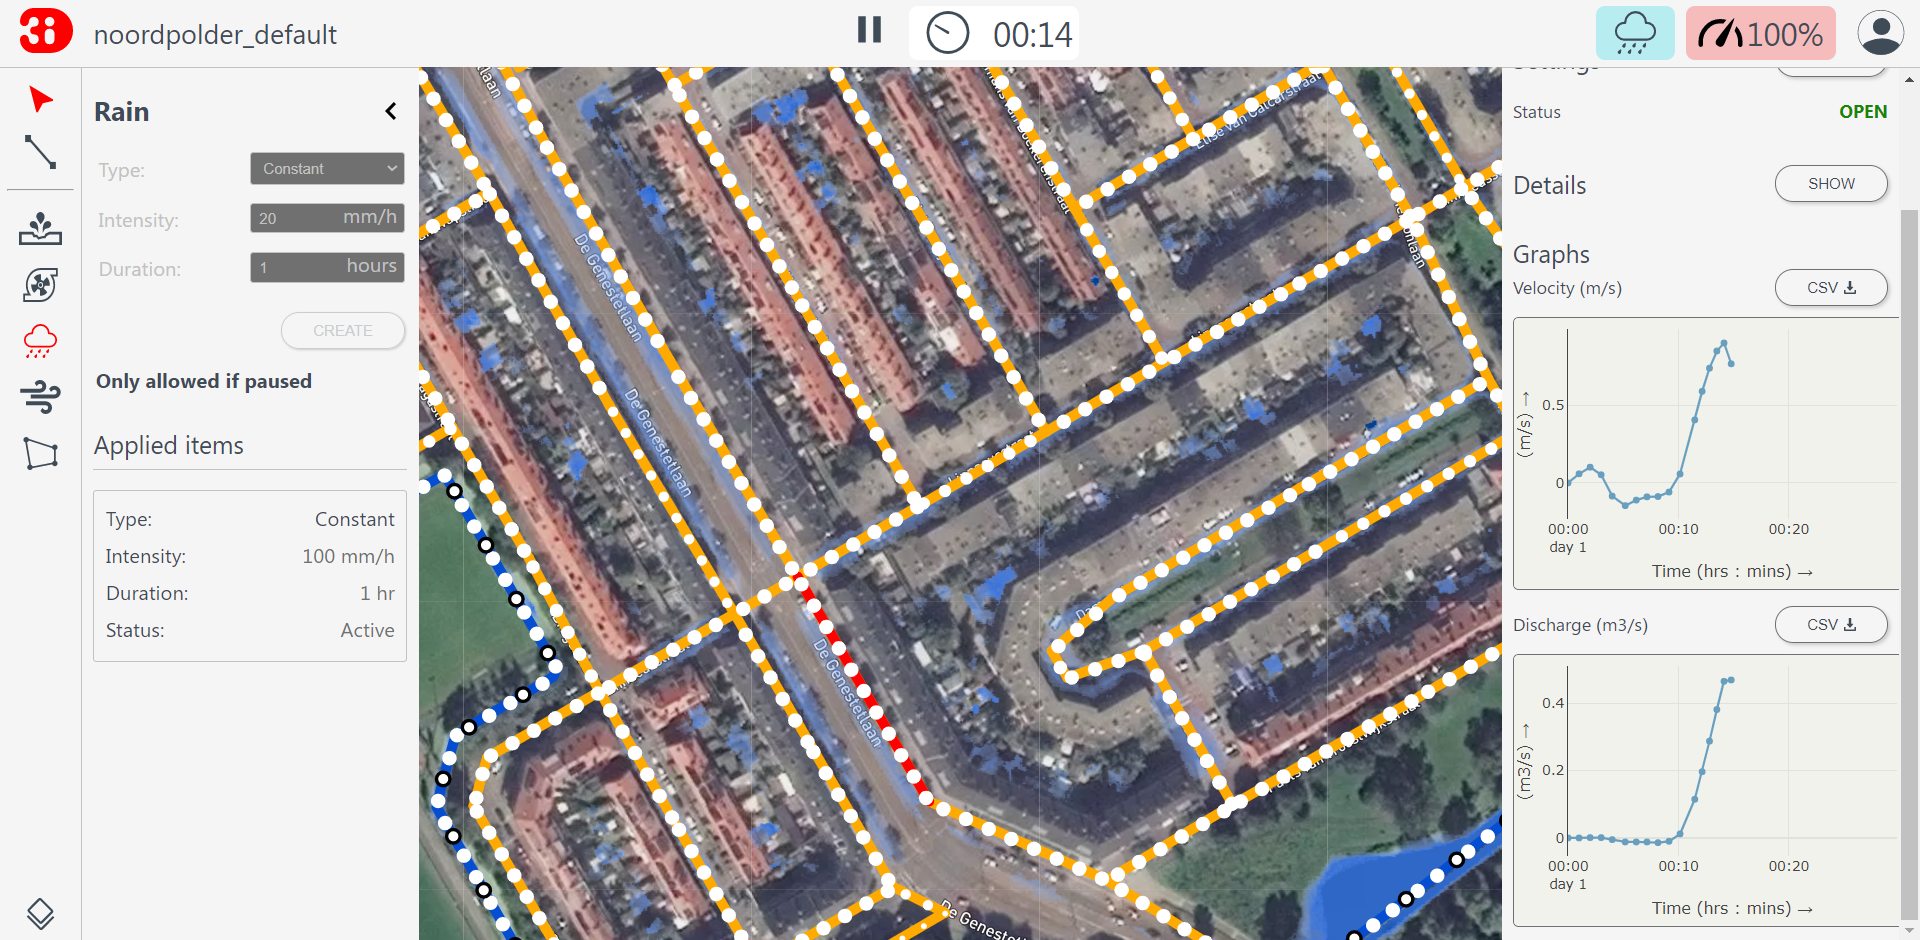
Channels and hydraulic structures may be part of a 3Di model. The channels show the direction of flow with the help of moving ‘waves’. The direction and speed are based on the flow velocity in the channel. 1D flow above 2 m/s is highlighted. The results (discharge, water level, water depth and flow velocity) are available at the structures by clicking on them with the Point selection tool.
Discharge and velocity are in the lines:
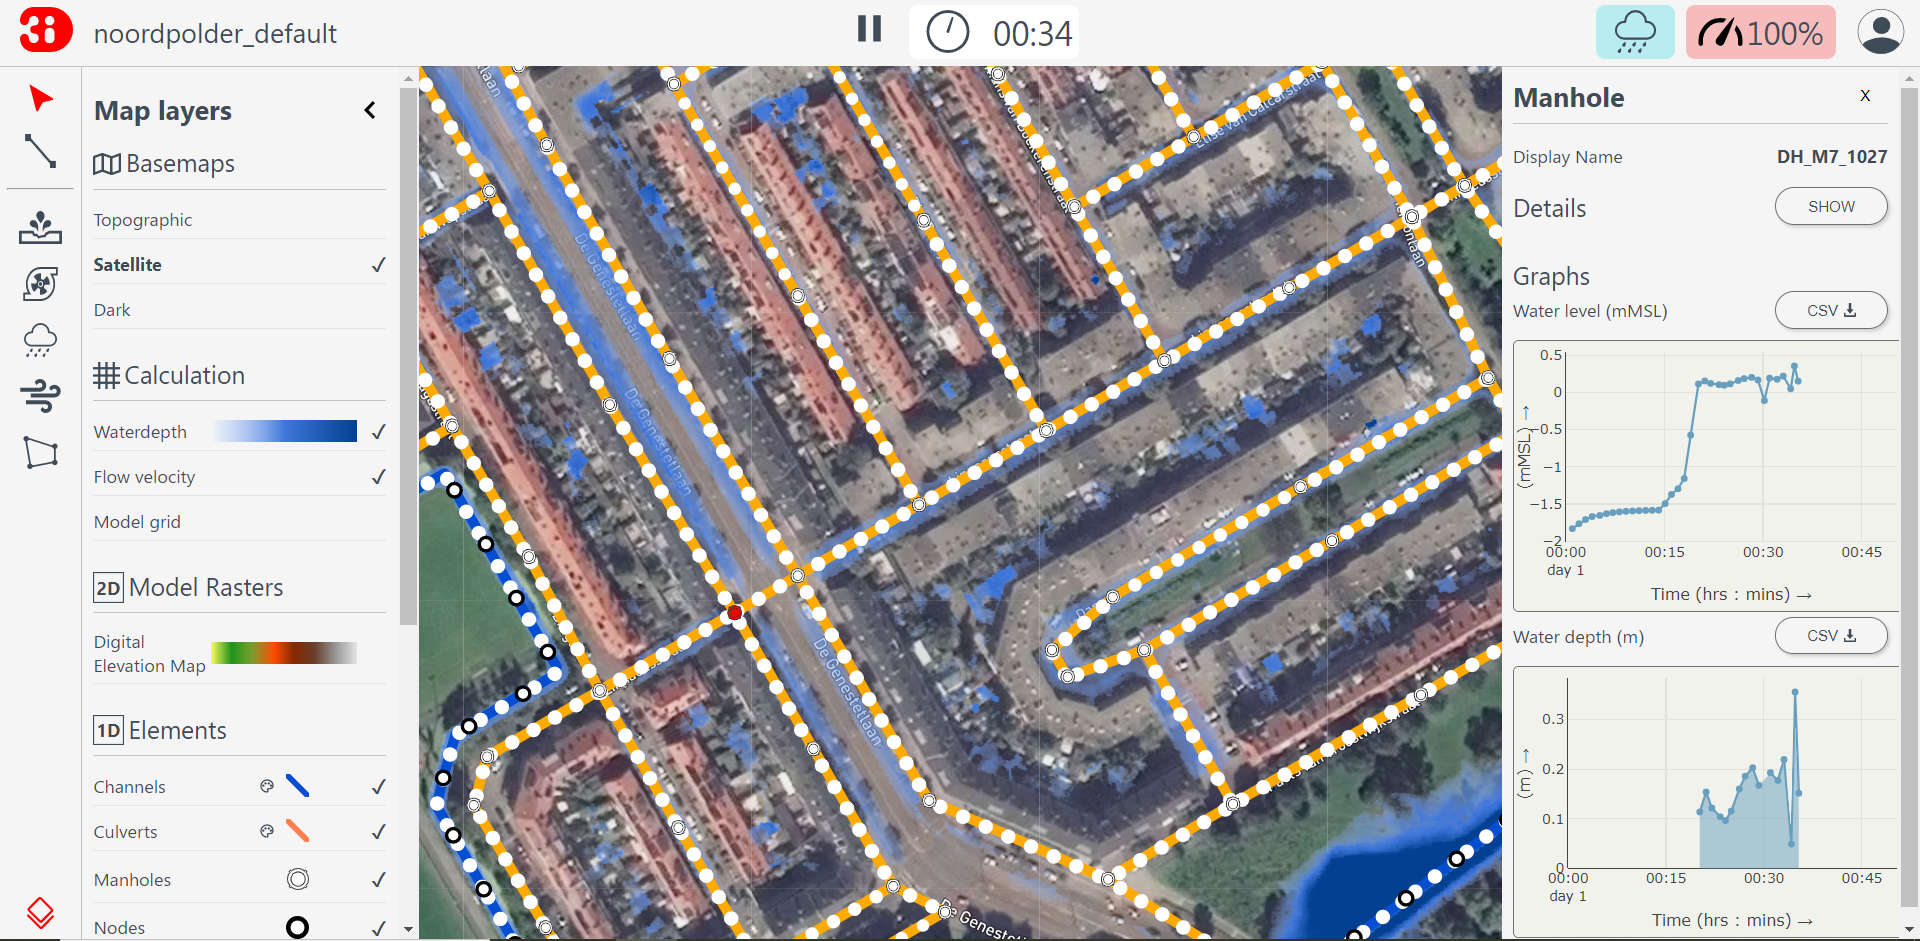
Water level and water depth are in the nodes:
2D flow
The direction of 2D flow is visualised with traces. The zoom level influences the level of detail of the flow pattern.